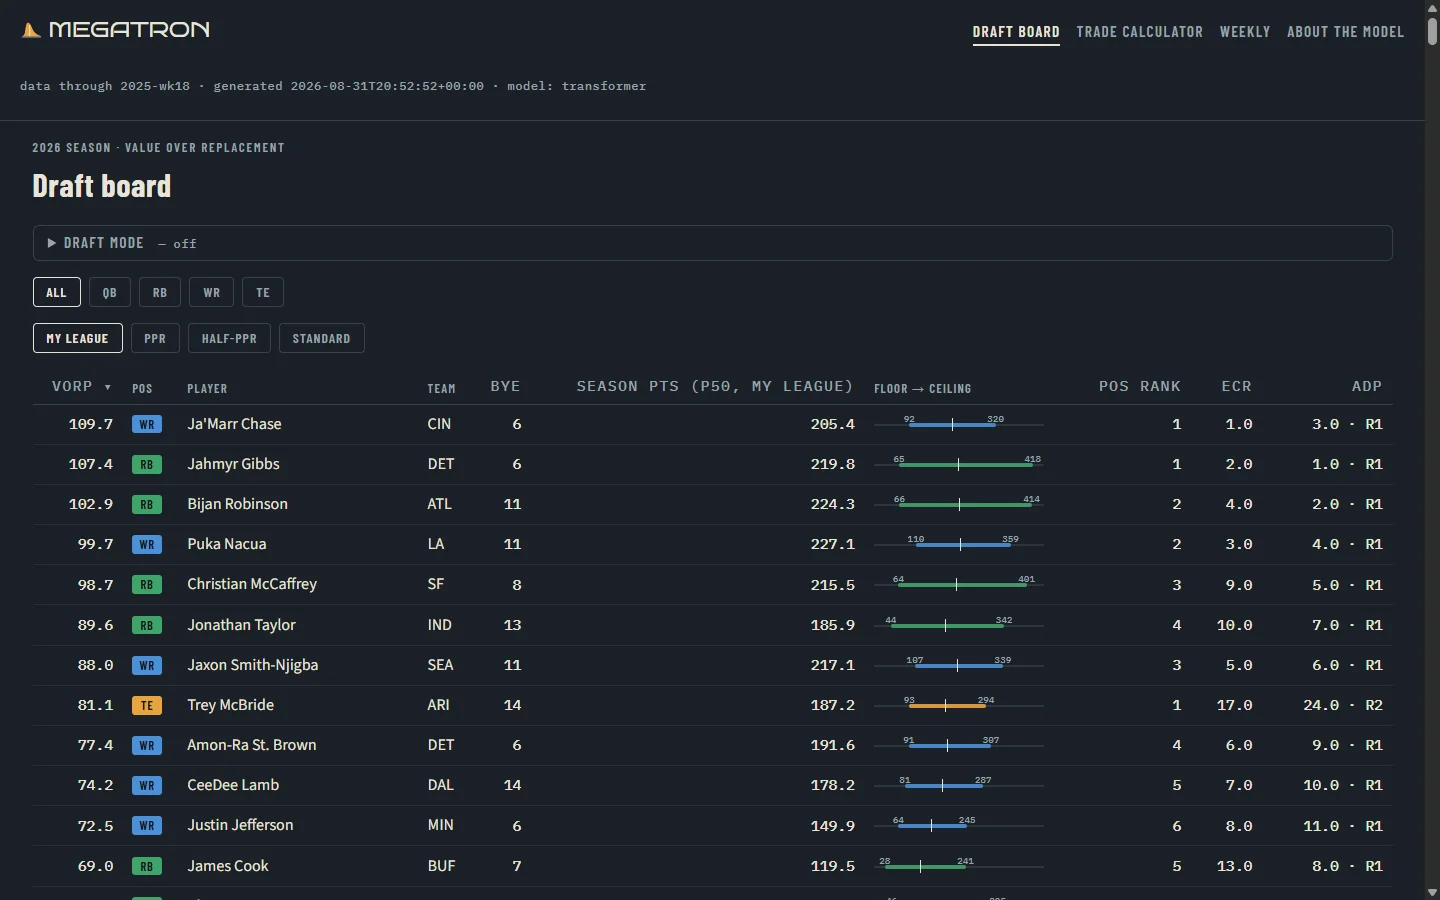
Fantasy projections are published everywhere. This one predicts raw stat lines with a small transformer, derives fantasy points from those by pure scoring functions, and reports its accuracy from held-out seasons rather than from a favorable training run.
Problem and failure definition
A projection is untrustworthy in two distinct ways, and most published projections only address the first. It can be inaccurate — the point estimate is far from the truth. It can also be overconfident — the interval it quotes does not contain the outcome as often as it claims. A p10–p90 band that catches the real result 60% of the time is under-covering its nominal target: the interval claims a confidence that its empirical hit rate does not support.
The model therefore had to be evaluated on both, on seasons it never trained on.
System
Predictions are made over raw stat lines, not fantasy points. Scoring is a pure function applied afterward, so PPR, half-PPR, standard, and a league’s custom rules all derive from a single set of predictions rather than requiring a model per format.
Evaluation is walk-forward: train on seasons up to n, test on n+1, advance, repeat. Nothing in the reported figures comes from data the model saw during training.
Verification
Test seasons 2023–2025, all positions, overall figures. Coverage is the empirical share of outcomes falling inside the nominal p10–p90 band, so 0.80 is the target.
| Model | Season | p10–p90 coverage | MAE | n |
|---|---|---|---|---|
| transformer | 2023 | 0.819 | 4.341 | 5893 |
| transformer | 2024 | 0.792 | 4.404 | 5920 |
| transformer | 2025 | 0.795 | 4.232 | 6095 |
| xgboost | 2023 | — | 4.430 | 5893 |
| xgboost | 2024 | — | 4.524 | 5920 |
| xgboost | 2025 | — | 4.392 | 6095 |
| naive_last4 | 2023 | — | 4.574 | 5893 |
| naive_last4 | 2024 | — | 4.673 | 5920 |
| naive_last4 | 2025 | — | 4.590 | 6095 |
Coverage is blank for the baselines because they produce point predictions and have no interval to evaluate. Scoring also uses pinball loss at each quantile, which rewards a correctly placed band rather than a merely narrow one. This is the same walk-forward standard described in the site’s verification method: report from held-out seasons, not from a favorable run.
Result
The transformer holds 79–82% empirical coverage against an 80% target across three held-out seasons, and beats both baselines on MAE in all three. That is what “calibrated” means here: the quoted intervals contain the outcome about as often as they claim to.
The published site is four static pages with no backend — a draft board with a pick-time optimizer that reads a live Sleeper draft, a trade calculator, weekly projections with bands, and an about page carrying these numbers.
Limits
Three seasons of walk-forward evaluation is a small sample, and coverage at 0.792 is slightly below nominal in one of them. The model is trained on a free Kaggle T4, which bounds capacity. There are no usage metrics for the site and none are claimed. Per-position coverage is computed but not yet published; overall coverage can conceal a position that is systematically miscalibrated, and that is the next thing worth checking.